Crash cities
Top ten cities and crashes
Analysing data from over the last decade, CarMoney has concluded where the most dangerous urban roads are.
The research has established the ten most populous cities in the UK had the highest number of accidents over the last 10 years. This may not be a complete surprise – more people, more vehicles – but it is an interesting perspective on the link between population, crashes, and where these predominantly occur.
Below are all the accidents that have happened in the top 10 most populous cities in the UK over the last decade.
‘Slight’ accidents are when a bump or shunt has taken place, while ‘significant’ indicates when a serious or fatal incident has occurred.
City Slight Significant All
London 27,514 4,650 32,164
Birmingham 7,689 1,336 9,025
Leeds 5,997 1,067 7,064
Leicester 5,698 701 6,399
Bristol 5,594 698 6,292
Nottingham 5,337 883 6,220
Liverpool 4,410 1,062 5,472
Glasgow 4,529 857 5,386
Sheffield 4,153 886 5,039
Edinburgh 4,193 801 4,994
* City centre and surrounding areas up to a radius of around 2km.
Crash Maps
Below they have taken all the accidents that have occurred over the last decade in each city and plotted them on a heat map, so you can see which areas are the most susceptible to car accidents.
London Over The Last Decade
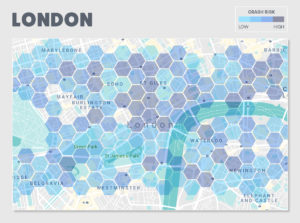
Significant Crashes = 34%
Increase All Crashes = 20% Increase
Total Crashes = 32.2k
Crash Rank = 1st
As you can see from the map, London’s condensed and chaotic nature means that a risk of an accident is widespread across the city. A key location that sees the highest density of collisions is around the Leicester Square area, which saw around 35 significant and 166 slight accidents occur over the last decade.
Birmingham Over The Last Decade
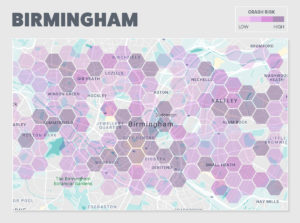
Significant Crashes = 44%
Increase All Crashes = 13% Increase
Total Crashes = 9k
Crash Rank = 2nd
Similar to London, Birmingham’s spread of car accidents is quite wide, due to the city’s size. However, the main area that sees the most crashes surrounds the city centre area as well as both the Chinese Quarter and Gas Street Basin areas.
These areas have a combined crash count of 738 slight and 144 significant accidents over the last decade.
Leeds Over The Last Decade
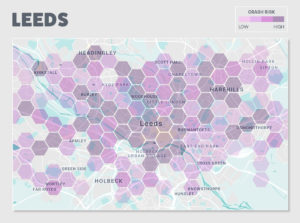
Significant Crashes = 29%
Increase All Crashes = 23% Decrease
Total Crashes = 7.1k
Crash Rank = 3rd
The crashes accounted for in Leeds seem to happen close to the city centre and even more so around the Briggate area of the city. In particular, the Vicar Ln and New Market St roads alone have seen around 30 significant accidents happen over the last 10 years, with 9 of those happening at the lights at the Kirkgate and New Market Street traffic lights.
Leicester Over The Last Decade
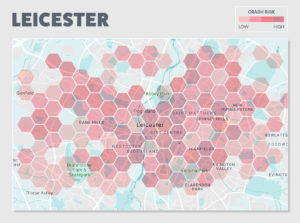
Significant Crashes = 34% Increase
All Crashes = 40% Decrease
Total Crashes = 6.4k
Crash Rank = 4th
Leicester’s heat map shows a similar scenario with many of the significant crashes happening around the city centre areas, but it’s far more condensed in relation to the rest of the city and surrounding areas.
As stated, the main area of concern is the city centre, with 284 significant and a massive 2094 slight accidents, all situated around a 1km area. You can also see that the A607 road that comes into the city is a hot spot for accidents with 5 significant accidents all occurring around a pedestrian crossing near the Empire Banqueting & Conference Hall.
Bristol Over The Last Decade
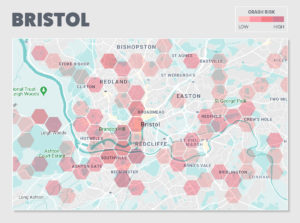
Significant Crashes = 37%
Decrease All Crashes = 6% Decrease
Total Crashes = 6.3k
Crash Rank = 5th
As you can see from the map, Bristol has a much more scattered area of significant accidents over the last 10 years, meaning the city centre is relatively safe in comparison to other cities on this list.
However, there are some hot spots that do seem to be the site causing the majority of accidents, such as the west side of the Broadmead area, from the Bear Pit down to the area around Queen Square.
Nottingham Over The Last Decade
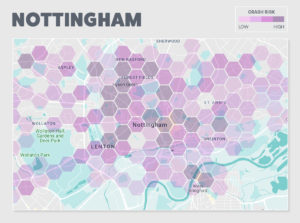
Significant Crashes = 1% Increase
All Crashes = 11% Increase
Total Crashes = 6.2k
Crash Rank = 6th
Nottingham sees significant accidents spread high and wide across the city and surrounding area. As usual, the main specific area where most accidents are happening is around the city centre, but there’s also a large portion of significant accidents happening up and around the Hyson Green and Radford areas, totalling just under 600 collisions over 10 years. Alfreton Rd and Gregory Blvd are hot spots for accidents in particular.
Liverpool Over The Last Decade
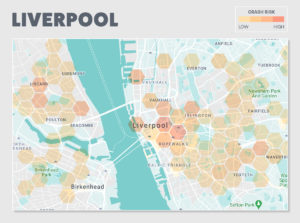
Significant Crashes = 2% Decrease
All Crashes = 10% Decrease
Total Crashes = 5.5k
Crash Rank = 7th
There are two main standout areas where a lot of accidents in Liverpool happen, the first being the area in and around the two railways stations, Liverpool Lime Street and Liverpool Central, and then the area around Victoria Street on the other side of the Liverpool One area.
The worst street is Hanover St, which has seen around 35 significant accidents occur over the last 10 years.
Glasgow Over The Last Decade
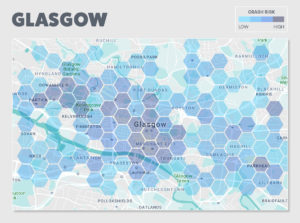
Significant Crashes = 8% Decrease
All Crashes = 38% Decrease
Total Crashes = 5.4k
Crash Rank = 8th
Glasgow’s significant accidents are, for the most part, revolving around the city centre, in particular Merchant City. This area has seen around 170 significant accidents occur over the last 10 years, with over 650 minor accidents in that same period. In fact, if you triangulate the area between Glasgow Central Station, Argyle Street Station and Glasgow Queen Street Station, we can see around 240 minor accidents just in this small area.
But there is one other location that sees a high amount of accidents located slightly outside the city centre to the west. Roads like Dumbarton Rd and Byres Rd, surrounding the University of Glasgow, both see very large number of accidents.
Sheffield Over The Last Decade
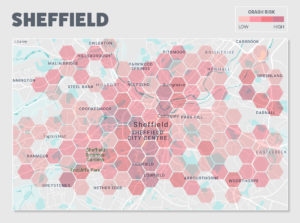
Significant Crashes = 163% Increase
All Crashes = 22% Decrease
Total Crashes = 5k
Crash Rank = 9th
Sheffield’s crash heat map shows a more natural display of significant accidents happening, with a more concentrated area being affected in the city centre and then gradually decreasing as we move out to the surrounding areas.
One particular area that sees a high volume of accidents taking place is the A621 that passes by Sheffield’s Bramall Lane stadium. Many accidents occur as you drive past this stadium, which then worsens at the roundabout that connects the road to St Mary’s Gate and St Mary’s Rd. This roundabout alone has seen 52 accidents over the last 10 years.
Edinburgh Over The Last Decade
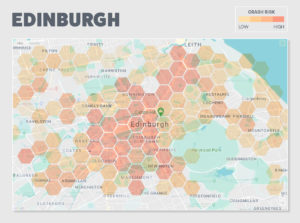
Significant Crashes = 31% Increase
All Crashes = 39% Decrease
Total Crashes = 4.9k
Crash Rank = 10th
With Edinburgh, most accidents happen in and around the city’s New and Old Town areas, up to the other end of the Princes Street Gardens, the most popular parts of the city. What wasn’t predicted was to see the number of accidents that occur on the A900, the road in between Edinburgh and its coastal neighbour Leith. This road has seen around 35 significant crashes, jumping to over 200 minor collisions over the last decade. The intersection between the A900 and A901 also sees a very high number of accidents, with 40 minor crashes taking place at this one spot.
Urban reality
As you can see, city centres tend to be a lot more dangerous than motorways and main roads. In fact, motorways, despite their higher average speeds and multi-lanes of traffic, remain the safest roads in the road network.
In May, the UN Road Safety Week calls for urban roads near housing, shops, parks and schools to deploy a default20mph (30kph) speed limit. It believes, through evidential research, that this will reduce deaths and the severity.
Children and young people are most at risk on the streets where they live, play and travel to school. Every day 3000 children and young people are killed or seriously injured on the world’s roads. A child hit by a car at 30 km/h (20 mph) can survive. Hit at 80 km/h (50 mph), most will die.
CarMoney’s original study here