Road work league table
Where are you most likely to get stuck in traffic due to roadworks?
Published on November 12, 2021
Roadworks may play a vital role in maintaining the infrastructure of the country, but they can certainly be frustrating.
On average it is estimated that UK motorists lose 28 hours a year due to being stuck in traffic caused by roadworks. No one using the road is immune. Even small works in the UK can feel like they take an eternity compared to other countries.
For example, in 2016 a major road in the Japanese city of Fukuoka was completely destroyed by a massive 15-meter deep sinkhole. However, it was completely repaired and reopened in six days.
Meanwhile, it is very hard to find a town in Britain that is not littered with long term potholes. There were 1.1 million of them recorded in 2016.
But not all areas of the country have the same level of roadworks. Moneybarn has undertaken an in-depth data-driven study into the areas with the most frequent and recent incidents of road and street works. By sending Freedom of Information requests to local authorities around the country, the roadwork capitals of the UK have been revealed.
Top Three Roadwork Capitals
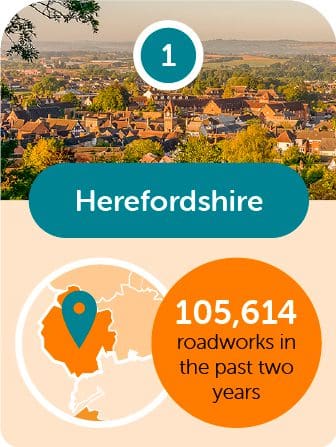
1. Herefordshire: 105,614 roadworks in the past two years
The west English county of Herefordshire has seen the most road and street works undertaken in the past two years. Over 100,00 makes it the only council area of any type in the country with a six-figure number of roadwork projects. Furthermore, it is almost 90,000 more than the national average for the same period.
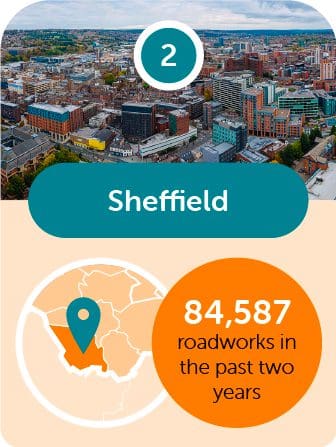
2. Sheffield: 84,587 roadworks in the past two years
Sheffield had just under 85,000 separate roadworks in the past two years. This makes it the roadwork capital city of the country. Within the city council boundaries of the Steel City, there were 44,677 roadworks in 2020/21. The longest took 19 days to complete. This is slightly higher than in 2019/20 when 39,910 works were carried out.
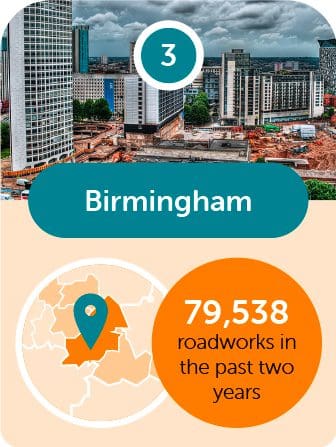
3. Birmingham: 79,538 roadworks in the past two years
Birmingham is the largest city council area with a population of almost 1 million more people than Sheffield. However, when it comes to roadworks there were 5,049 fewer roadworks in the second city over the past two years. This is largely due to a 36% decrease in the number of roadworks taking place in Birmingham in 2020/21 than the previous year.

Top three areas with least amount of roadworks
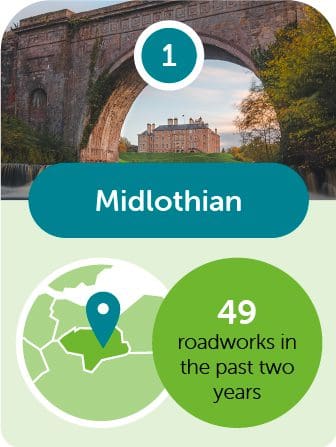
1. Midlothian: 49 roadworks in the past two years
The area of the UK with the fewest number of roadworks over the past two years is Midlothian in Scotland. It covers an area from south Edinburgh to the Borders. Incredibly, there were only 49 recorded road and street works in the period. This amounts to only 0.05% of the number of roadworks in Herefordshire.
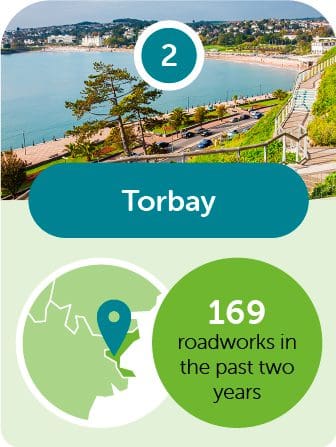
2. Torbay: 169 roadworks in the past two years
Torbay is a small council area on the south coast of Devon in South West England. Here driving is clearly stress-free for the seasiders as there were only 169 recorded roadworks in the past two years. The longest of these works lasted 86 days at Babbacombe Road for resurfacing.
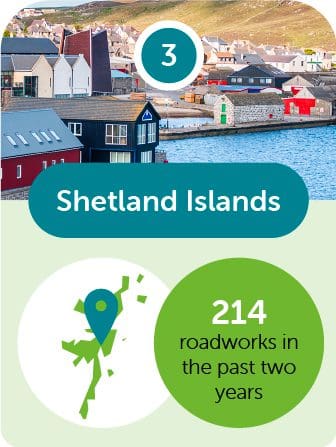
3. Shetland Islands: 214 roadworks in the past two years
From one end of the country to the other. The Shetlands are the most northern point of the UK, 110 miles from the top of the mainland. In the past two years, Shetlanders have only suffered 214 separate roadworks in place across the island.

Areas with the biggest increase in roadworks in the past year
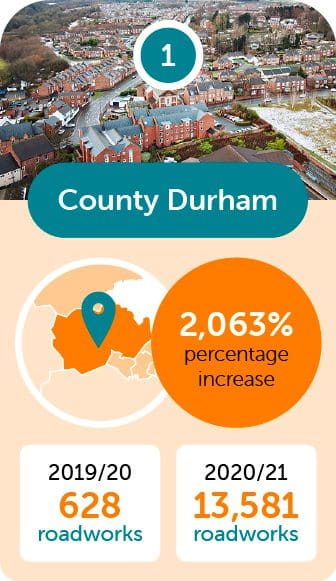
1. County Durham: 2063% increase
2019/20 – 628 roadworks
2020/21 – 13,581 roadworks
In County Durham, there has been an astronomical rise in the number of roadworks in the past year. The total number shot up by almost 13,000. This is blamed on the coronavirus pandemic delaying a large number of works so they did not begin until 2020/21.
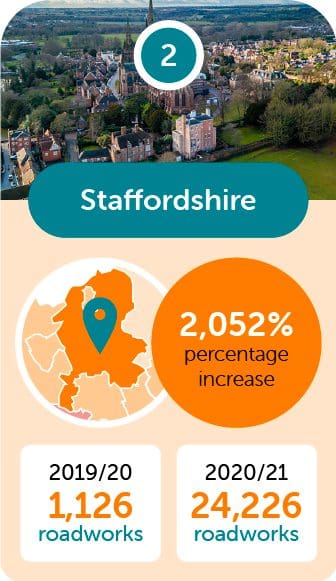
2. Staffordshire: 2052% increase
2019/20 – 1,126 roadworks
2020/21 – 24,226 roadworks
Staffordshire has the second-highest increase in the number of recorded roadworks. In 2019/20 there was just over 1,000, whereas in 2020/21 there were almost 25,000 road and street works recorded by the council.
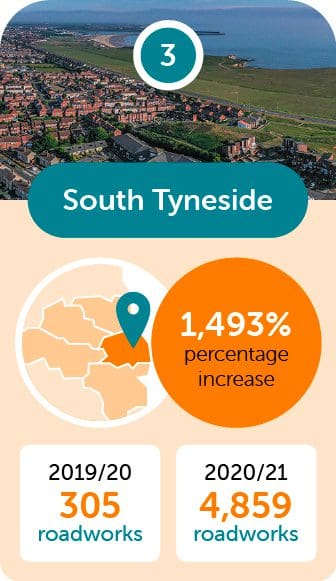
3. South Tyneside: 1493% increase
2019/20 – 305
2020/21 – 4,859
One of the longest ongoing works on South Tyneside were bridge repairs that are scheduled to take eight months. Along with this are an extra 4,554 more roadworks than in the previous year.
Areas with the biggest decrease in roadworks in the past year

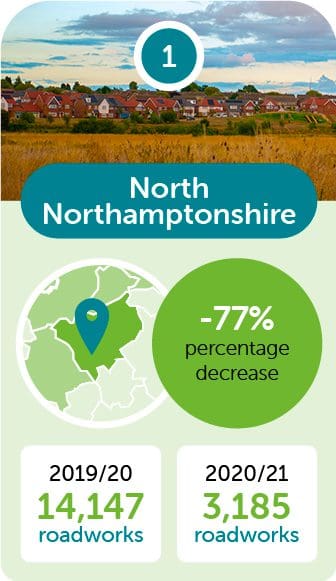
1. North Northamptonshire: 77% decrease
2019/20 – 14,147
2020/21 – 3,185
The biggest decrease in the number of roadworks occurred in north Northamptonshire. Residents have had the biggest easing of roadwork related driving problems anywhere in the country.
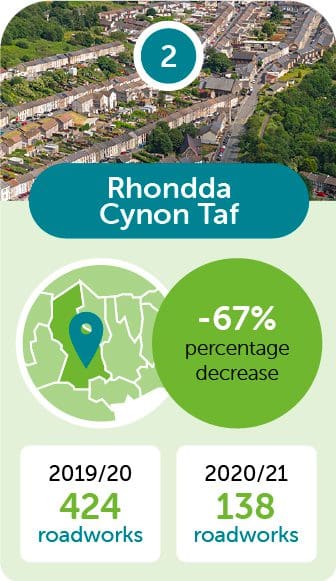
2. Rhondda Cynon Taf: 67% decrease
2019/20 – 424
2020/21 – 138
The South Wales area of Rhondda Cynon Taf has seen the second-biggest decrease in the number of roadworks from 2019/20 to 2020/21. Two years ago there were 424 separate roadworks, decreasing by 67% to 138 in the last year.
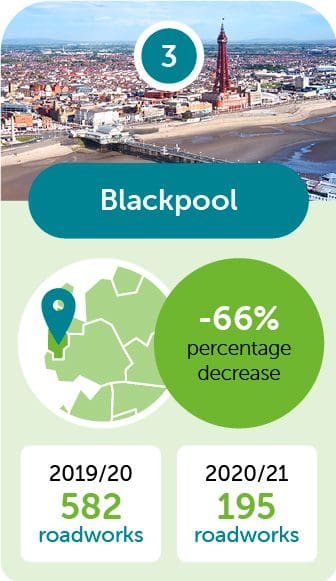
3: Blackpool: 66% decrease
2019/20 – 582
2020/21 – 195
The only thing dropping faster than those riding the ‘Big One’ in Blackpool is the frequency of roadworks. There was a 66% decrease from 582 separate roadworks in 2019/20 to 195 in 2020/21.

You can find the full report here.