
Dicing with danger
Statistic show an ongoing sad reality for young driver crashes
The price of youth
UK young driver crash statistics show that in 2021, there were 78 young car driver deaths. This made up 16% of all deaths on UK roads. This is despite the fact that just 7% of drivers are under-24. Effectively this means that young drivers are twice as likely to die in a road crash as older drivers.
More than 6,500 UK drivers were in serious car crashes, of which 1,201 were young car drivers (18%).
(Source: GOV.UK)
The percentage of young drivers involved in slight crashes does decrease as a proportion compared to older drivers, but only minimally to 17%. In 2021, young driver accident statistics show that there were 7,474 young car drivers in minor incidents, compared to 42,736 of all car drivers.
On the whole there were 8,753 young car drivers involved in an accident of any type, meaning that they were involved in 18% of all car accidents that year.
Getting better
Fortunately, the number of young driver fatalities in the UK is decreasing. The number of young car drivers involved in reported road accidents has fallen significantly since its peak in the 1990s.
Close to 90,000 young drivers were involved in accidents in 1990; by 2013 this figure had fallen by two-thirds to 30,000.
Young drivers statistics show that the number of fatal or serious crashes involving at least one driver under the age of 24 have consistently fallen year-on-year between 2004 and 2020. Casualties of passengers of young drivers have also gone down by 69% in a 17-year period, from 3,006 in 2004 to 926 in 2021.
The first year
Young drivers insurance statistics show that one in five drivers (20%) will have a major or minor crash within a year of passing. However, with experience on the road and rising age and competence, their likelihood of being in a crash does reduce.
Young drivers under 25 have a claim rate that’s 27% higher compared to drivers over 25. On top of this, one in five accidents involving young adults have an injury claim. This means that 30% of all claims are made by under-24s.
Unlike older drivers, young drivers will spend more of their time driving at night. Statistics about young drivers show that 6% of all miles driven by under-24s happen at night, compared to 3% for older drivers..
However, most driving, across all age groups occurs during the day.
When it comes to miles on the road, 97% are driven between the times of 5am and 9:59 pm. Young drivers are no exception to this.
Around half of drivers aged 17-24 use their car to commute to work, with a further 10% using it to get to their place of education, whether that be school, college or university.
Road accidents by hour and day in 2021
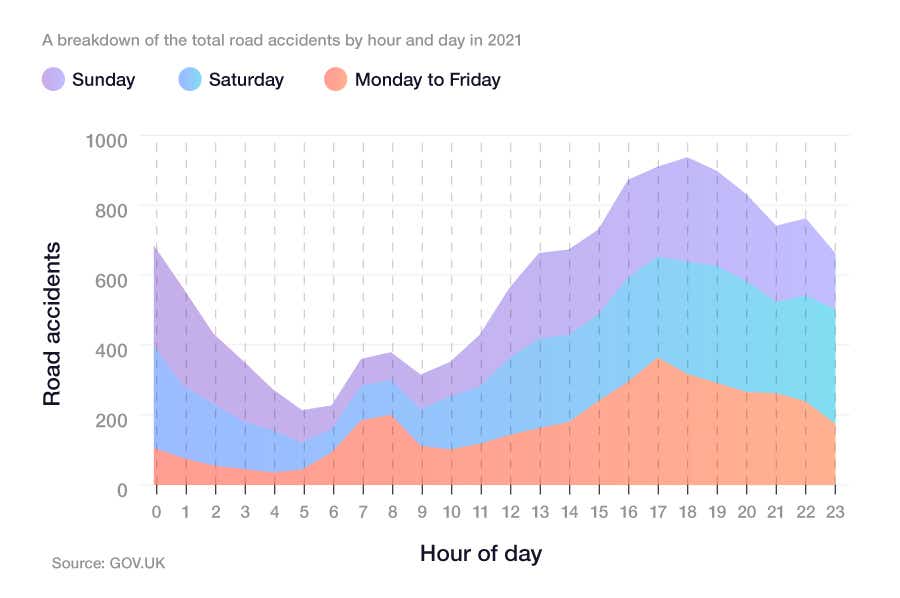
Young people drive more at night than older drivers, particularly at weekends. Crash rates follow a similar statistical route.
While the most common time for an accident to occur for a young driver is at 5pm on a weekday, other leading times include:
-
7pm on a Saturday
-
12am on a Saturday morning
-
11pm on a Saturday night.
There were 25% more accidents on a Saturday compared to a weekday in 2021.
In all, 8% of all accidents occur between the hours of 10pm on a Saturday night and 2am on a Sunday morning.
Road accidents occurred less often during the week compared to at the weekend.
The least common time for a KSI accident to occur was at 4am on a weekday, just before the commuter rush. Only 0.2% of all accidents happened at this time.
On the road
Young drivers statistics show that a critical mass of young drivers are apprehensive about using motorways.
More than four in 10 (41%) young people admit to knowing friends who were so nervous of using motorways, they refused to drive on them.
Just 7% of young drivers admitted that they themselves avoided driving on motorways, compared to just 4% of over-65s.
But rural and country roads remain a high risk environment for young drivers. What’s more, the seriousness of injuries is higher due to speed and time taken for emergency services to arrive.
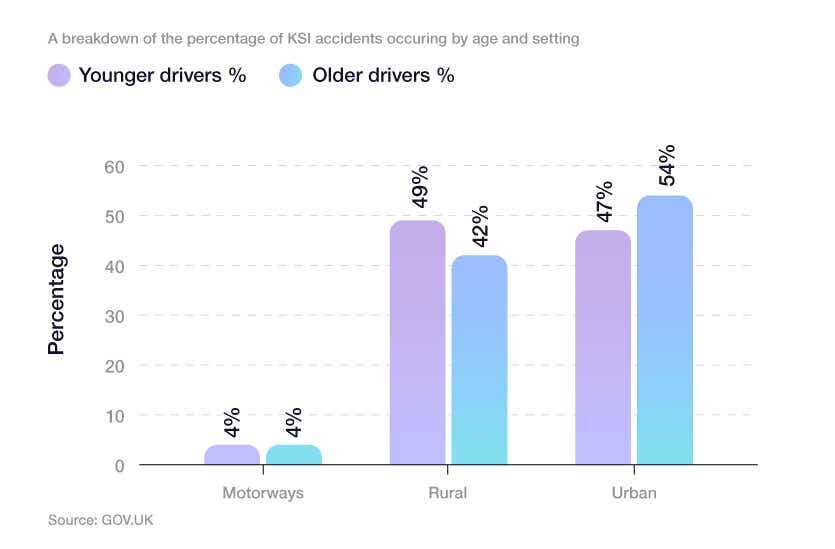
So, despite their fears around driving on motorways, the statistics suggest they are the safest type of road. It is true whatever age the driver is. Young driver death statistics show that just 4% of KSI (killed or seriously injured) casualties involving young drivers occur on the motorways.
Young drivers are ten times less likely to be killed on a motorway than they are on a country road.
For older drivers, KSI incidents in Britain between 2016-20 were more than 10 times less likely to happen on motorways compared to rural and urban roads. It reveals the safety of high speed relatively straight and wide motorways. Compare this to the dangers of bendy, often blind bends, commonly narrow roads. Include in this, less predictable road surfaces, slow moving agricultural vehicles and animals.
KSI collisions between 2016-20, show that rural roads are the most dangerous for young drivers . Despite just 2.2 million young people living in rural areas, almost half (49%) of KSI collisions involving under 24-year-olds occurred on rural roads.
For older drivers, the respective figures are slightly different with a lower percentage of KSI collisions occurring on rural roads (42%). Instead, over half (52%) take place in urban areas, compared to less than half (47%) for young drivers.
Age matters
Teenage drivers accident rates show that the risk of motor vehicle crashes is higher among teens aged 16-19 than it is for any other age group.
The fatal crash rate of teenagers is almost three times higher than for drivers aged over 20.
Statistics from 2020 show that almost 1.5 million young males held a driving licence, compared to just 1.3 million young females. Approximately 52% of all young drivers are male.
UK male vs. female statistics also suggest that young male drivers tend to drive more often and further than female drivers. In 2013, an average of 4,432 miles compared to 3,453 miles.
You can learn more about young driver in this Uswitch car insurance guide.