Who’s picking up the points
New survey reveals licence points hotspots
Points mean…
|
Rank |
Town/city |
County |
Population |
Drivers with penalty points |
Drivers with points per 10,000 people |
% of drivers with penalty points |
|
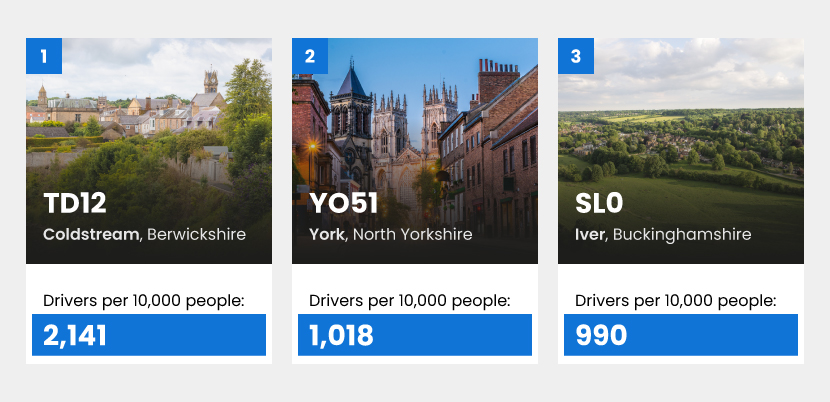
1 |
Coldstream |
Berwickshire |
1,163 |
249 |
2,141 |
21.41% |
|
2 |
York |
North Yorkshire |
5,533 |
563 |
1,018 |
10.18% |
|
3 |
Iver |
Buckinghamshire |
11,119 |
1,101 |
990 |
9.90% |
|
4 |
Telford |
Shropshire |
2,903 |
275 |
947 |
9.47% |
|
5 |
Bradford |
West Yorkshire |
24,979 |
2,336 |
935 |
9.35% |
|
6 |
Aylesbury |
Buckinghamshire |
13,522 |
1,194 |
883 |
8.83% |
|
7 |
Uxbridge |
London |
14,538 |
1,261 |
867 |
8.67% |
|
8 |
Hinton St. George |
Somerset |
442 |
38 |
860 |
8.60% |
|
9 |
Watlington |
Oxfordshire |
4,324 |
371 |
858 |
8.58% |
|
10 |
Towcester |
Northamptonshire |
23,027 |
1,954 |
849 |
8.49% |
Unguarded moments
Pointing out the facts
-
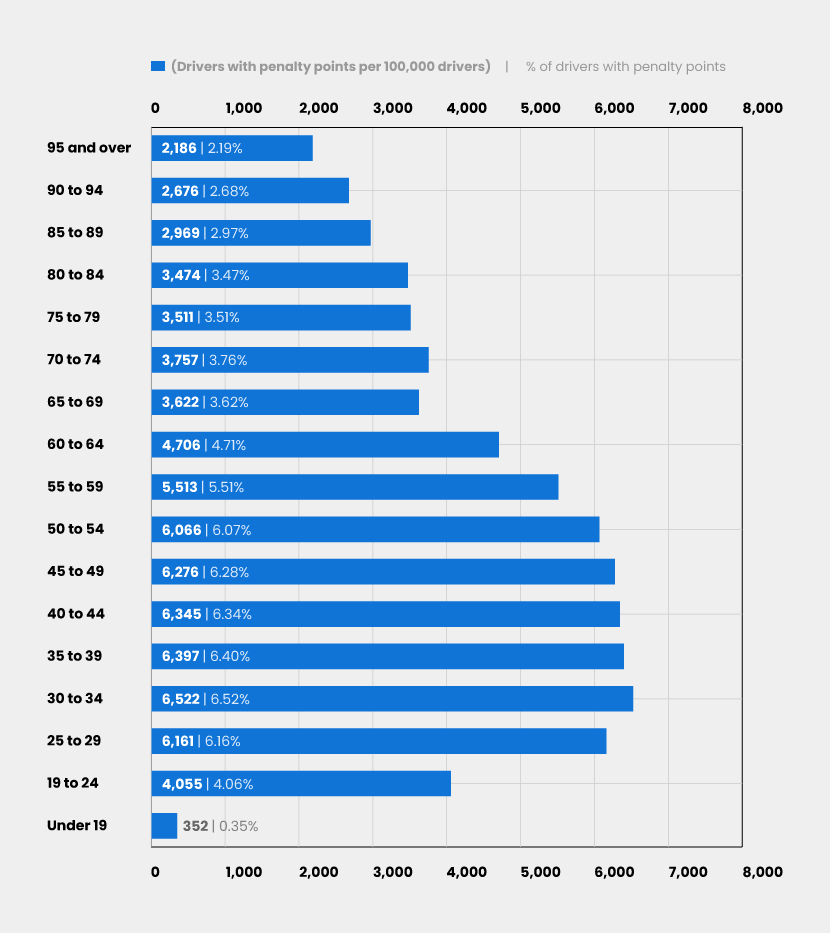
The most common age bracket to have penalty points is age 30 to 34, with 6,522 per 100,000 drivers with penalty points on their licence.
-
1,893,989 male drivers in the UK have penalty points on their driving licence, in comparison to 766,286 female drivers.
-
The most common penalty offence in the UK is exceeding the statutory speed limit on a public road (SP30), with 2,158,179 offences